The strandings reported in the tables and graphs below include dugongs, marine turtles and humpback whales that were dead, sick, injured, incapacitated, entangled or rescued. The numbers may be subject to change as additional information and reports are received. Reports that have not yet been verified by staff as being accurate are not included.
Table 1: Total annual dugong strandings reported and verified for each calendar year, and from 1 January to 21 November of 2018.
Year
2014
2015
2016
2017
2018
Total
49
21
24
18
22
Table 2: Regional distribution of dugong strandings reported and verified for the period from 1 January to 21 November of each year.
Location
2014
2015
2016
2017
2018
Moreton Bay, 27°
9
4
8
3
4
Hervey Bay, 25°
2
5
4
4
4
Rockhampton, 23°
1
2
0
2
2
Mackay, 21°
1
3
2
1
1
Townsville, 19°
2
1
5
4
7
Cairns, 16°
0
1
0
1
1
Remainder of Queensland
32
5
3
2
3
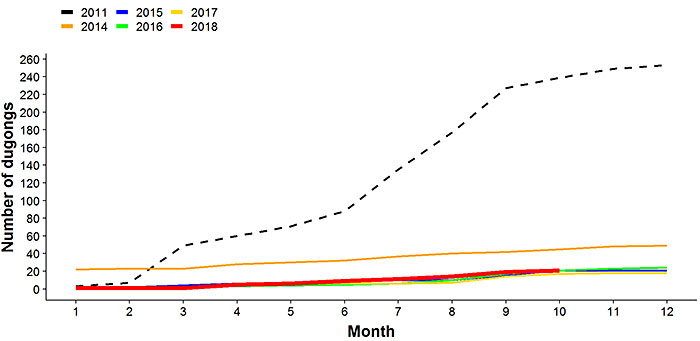
View larger image
Figure 1: Cumulative dugong strandings per month for each year since 2014. For comparision, the black dashed line indicates the record number of dugong strandings in 2011 after the severe weather events of summer 2010–11.
Table 3: Total annual marine turtle strandings reported and verified for each calendar year, and from 1 January to 21 November of 2018.
Year
2014
2015
2016
2017
2018
Total
1217
840
607
573
374
Table 4: Regional distribution of marine turtle strandings reported and verified for the period from 1 January to 21 November of each year.
Location
2014
2015
2016
2017
2018
Moreton Bay, 27°
436
280
278
269
227
Hervey Bay, 25°
162
56
61
50
4
Rockhampton, 23°
106
48
35
36
35
Mackay, 21°
29
21
13
11
7
Townsville, 19°
68
51
29
42
27
Cairns, 16°
18
23
12
10
9
Remainder of Queensland
309
280
103
79
65
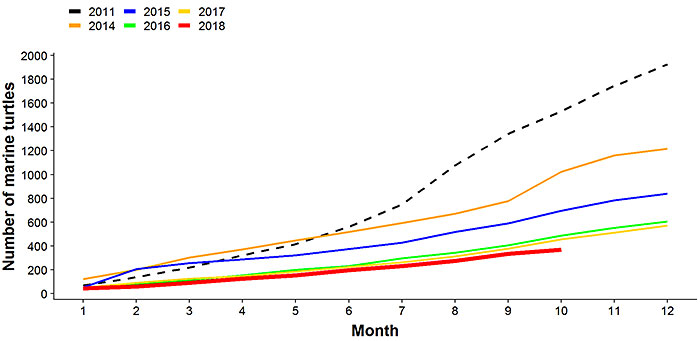
View larger image
Figure 2: Cumulative marine turtle strandings per month for each year since 2014. For comparision, the black dashed line indicates the record number of marine turtle strandings in 2011 after the severe weather events of summer 2010–11.
Table 5: Total annual humpback whale strandings reported and verified for each calendar year, and from 1 January to 21 November of 2018.
Year
2014
2015
2016
2017
2018
Total
13
11
22
47
16
Table 6: Regional distribution of humpback whale strandings reported and verified for the period from 1 January to 21 November of each year.
Location
2014
2015
2016
2017
2018
Moreton Bay, 27°
3
4
8
9
3
Hervey Bay, 25°
1
3
3
15
4
Rockhampton, 23°
0
0
0
2
0
Mackay, 21°
1
1
0
2
1
Townsville, 19°
0
0
1
0
0
Cairns, 16°
0
0
0
1
0
Remainder of Queensland
8
3
10
18
8
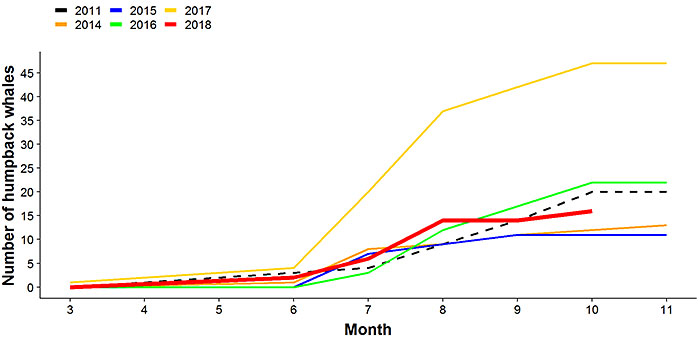
View larger image
Figure 3: Cumulative humpback whale strandings per month for each year since 2014. For consistency with Figures 1 and 2, strandings from 2011 are also included as the black dashed line.